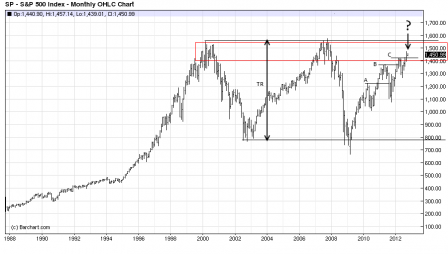
I have some thoughts I want to share about financial markets. Let’s begin with S&P as the one of the largest of stock market indexes. I took monthly chart and marked some points which I think might give me clues to understand what’s going on. I do not pretend for deeply understanding of macroeconomic processes but I just try to apply common sense to the situation.
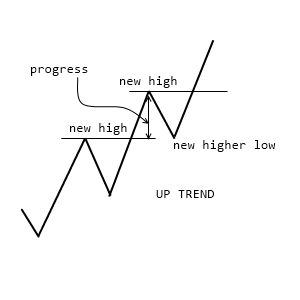
In order to help you to understand what I am talking about I need to disclose some basic elements of markets which I take into account. First and foremost I do believe that on financial markets operate much more informed and intelligent (than me) group of professionals who make “markets music”. I do believe in trends and I have really simple definitions for them, such as: up trend – each new high higher than previous one and each new low higher than previous one too and opposite definition for down trend. Then I want to know the strength of trend and in order to measure it I use progress between each new high, the bigger progress - the stronger trend. I pictured my points of view.
Let’s apply my simple rules to S&P 500. We have large trading range (I hope you are familiar with this terminology) marked “TR” from 800 to 1560 points. Red rectangle shows where professionals sold their positions in 2000 and 2007 years before markets turned down. I hope that it is quite obvious that we have up trend since 2010 year and if we take into account shortening of the progress between points “B” and “C” then I can assume that the trend slows down. As the result we have the up trend which slows down in red zone where professionals sold their positions two times before.
Now it’s time to think how we can use the situation. As you know market can be in three phases: trading range, up trend and down trend at any given time. What I need to do is to make scenarios which fit each of phases and choose more possible way for market to move. The first scenario is strong up trend which brings index to a new historical high. The second one is up trend with reactions which keep index in trading range in between 1400 and 1560 points and the third one is down trend with first support line at 1300 points.
I didn’t put any kind of fundamental approach here, however I am a bit surprised to see index at the same level as it was in 2007 without evidence of business booming as it was 5 years ago, by my opinion it is quite possible that the only reason is just inflation.
I want to add that my approach works for me quite well on all time frames and please keep in mind that I just share my point of view without any kind of intention to advise you how to trade or what to trade and when.