Initially, when I heard the news about what is going on Cyprus I felt a kind of anger, they (governments) always force people to pay for their mistakes and now it’s another time. Later on, after I slept over the news I think that the decision to get a piece of Russian laundry cake probably good decision to resolve the situation. Still, it has its flaws of cos. Well, that was some feelings to share and now the time to observe whether a small trader can make sense of the situation merely watching prices. It’s obvious that stock markets having rally since November of 2012, however some thing happened during last four-five weeks which I want to ask your attention for. But, instead of looking on stocks let’s take a look on USA bonds. I do believe that it possible to understand what is going on just following prices and now, I’ll show another example how it works for me to understand the situation.
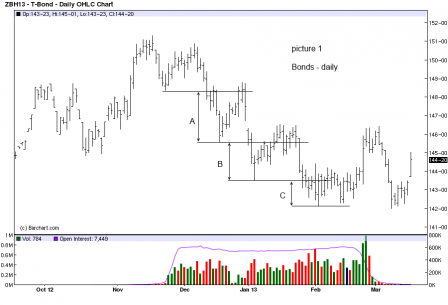
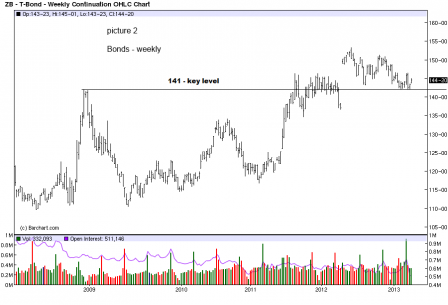
Take a look on the picture 1, where we can see down trend since November 2013 and no doubts it was still intact to the end of the February, however its character changed and we can catch it. Look at the progress on A, B and C down waves, down trend gets slower to the wave C and it becomes obvious that from the end of January investors don’t want to watch bonds lower. Now the bigger picture gives me more clues, from weekly perspective on the picture 2 we can watch one interesting key level which begins from December 2008. Let’s put slowing down trend and this key level together and market puzzle looks clearly now.
So, I had no clue about the decision what was made for Cyprus by Eurozone officials, however prices don’t lie.
Please, keep in mind that I don’t advise you to buy or sell anything and merely share some useful (at least for me) knowledge.
Thanks.
Paul.